
What we have seen in Shopify trading reviews is this: many merchandising dashboards are busy, detailed, and still not very useful. They measure revenue output, but they do not tell the team whether the store is becoming easier to shop, easier to trade, or more profitable to scale.
If your reporting is heavy on charts but light on decision value, Contact StoreBuilt.
Table of contents
- Keyword decision and research inputs
- What competitor content gets right and where it stays shallow
- Why revenue-only merchandising reporting fails
- Merchandising reporting table for Shopify teams
- How to build a weekly reporting cadence
- Signals by page type and commercial objective
- StoreBuilt client example
- Final StoreBuilt point of view
Keyword decision and research inputs
Primary keyword: shopify merchandising reporting
Secondary keywords:
- ecommerce merchandising reporting framework
- ecommerce UK market trading dashboard
- shopify category reporting
- shopify merchandising KPI framework
- shopify weekly trading metrics
Search intent: operational and strategic. Readers want a reporting model they can actually run inside a Shopify-led ecommerce operation.
Funnel stage: middle.
Page type: framework guide with practical tables.
Why StoreBuilt can win this topic:
- We connect merchandising decisions to SEO, CRO, product structure, and trading cadence instead of treating reporting as a BI-only problem.
- We regularly review stores where category and campaign changes are happening faster than reporting maturity.
- We can explain which numbers help merchants act and which numbers mostly create noise.
Research inputs used on June 15, 2026:
- SERP review around Shopify merchandising, ecommerce reporting, category KPIs, and weekly trading dashboards.
- Public competitor-content review across UK Shopify agencies publishing long-form guides, especially editorial structures similar to Charle’s article model.
- StoreBuilt observations from merchandising, CRO, search, and support audits where reporting quality shapes day-to-day decision speed.
What competitor content gets right and where it stays shallow
Good UK ecommerce content increasingly explains that merchandising is more than putting products on the homepage. The better articles now discuss category logic, onsite discovery, campaign timing, and customer intent.
That is useful progress.
The weaker part of the category is what happens after those decisions go live. A lot of content still stops at “improve product discovery” or “optimise collections” without showing what a team should measure every week to know whether those changes actually improved trading quality.
This is where StoreBuilt takes a stricter view. Merchandising only becomes operationally useful when reporting helps the team answer practical questions:
- Are customers finding the right products faster?
- Are campaigns shifting demand in the right places?
- Are stock and margin pressure getting worse?
- Is search traffic landing on commercially healthy category journeys?
Without those answers, merchandising becomes subjective and highly dependent on whoever shouts loudest in the weekly meeting.
Why revenue-only merchandising reporting fails
Revenue matters, but it is an incomplete merchandising signal.
Two stores can show similar top-line results while having very different commercial health underneath. One may be improving product discovery, margin mix, and inventory flow. The other may be relying on deeper discounts, weak category logic, and more support friction.
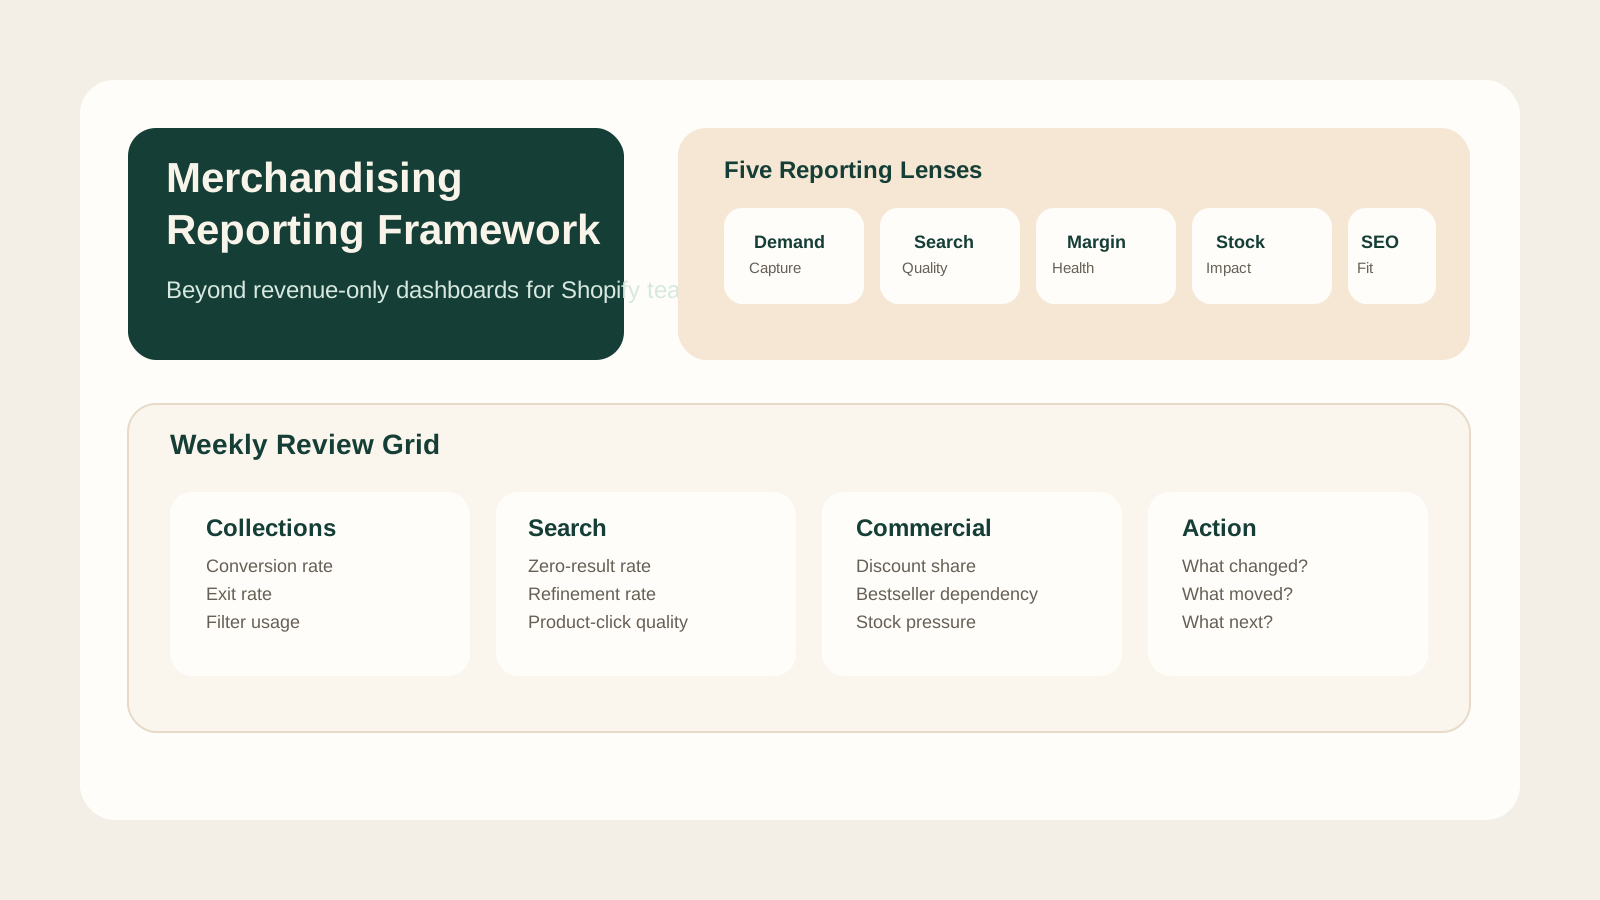
That is why merchandising reporting should cover five layers:
- Demand capture
- Product discovery quality
- Commercial efficiency
- Stock and availability impact
- Search and campaign alignment
Teams that only track revenue by collection or campaign usually miss important problems:
- a category grows because of discount pressure rather than genuine demand quality
- search exits rise because landing pages and onsite navigation do not match
- bestseller concentration increases and hides weaker category architecture
- out-of-stock friction forces customers into poor substitute journeys
At StoreBuilt, one simple rule often helps: if the dashboard cannot explain why revenue changed, it is not finished yet.
Merchandising reporting table for Shopify teams
| Reporting area | Core question | Recommended signal | Why it matters |
|---|---|---|---|
| Category performance | Are key collections helping customers self-sort well? | Collection conversion rate, exit rate, filter usage | Shows whether discovery is working |
| Search behaviour | Are users finding products through onsite search? | Search refinement, zero-result rate, search-to-product click rate | Reveals intent mismatch and taxonomy gaps |
| Product mix | Is category growth healthy or concentrated? | Revenue share by product group, bestseller dependency | Protects against over-reliance on a small subset |
| Margin quality | Is growth commercially clean? | Discount share, contribution by category, promo dependency | Stops vanity revenue reporting |
| Stock pressure | Is merchandising pushing unavailable or fragile inventory? | Out-of-stock exposure, low-stock click share, substitute click behaviour | Connects trading with operations reality |
| Traffic alignment | Are campaigns and organic landings supporting the right category paths? | Landing-page engagement, bounce quality, assisted conversion | Connects acquisition to merchandising outcomes |
This framework does not require enterprise tooling before it becomes useful. It requires clean definitions and consistent review discipline.
If you need the reporting layer tied more tightly to storefront changes, StoreBuilt can help with CRO and UX execution.
How to build a weekly reporting cadence
The reporting model becomes more effective when it is linked to trading rhythm rather than monthly hindsight.
For most Shopify teams, a practical weekly cadence looks like this:
Monday: category health review
Review:
- top collections by sessions, conversion, and exit
- onsite search friction
- low-stock categories receiving campaign or homepage emphasis
The goal is to identify whether discovery and demand are aligned before more changes go live.
Midweek: campaign and landing review
Review:
- paid and email landing-page behaviour
- product availability by campaign group
- promotional dependency versus planned margin
This is where teams often discover that strong traffic is landing on weak merchandise paths.
Friday: action log and ownership review
Review:
- what changed
- what signal moved
- what needs escalation next week
That final step matters because reporting without action logging quickly turns into repetitive observation rather than operating improvement.
Signals by page type and commercial objective
One mistake we see often is expecting the same metrics to explain every merchandising surface.
Collection pages
Focus on:
- conversion rate
- exit rate
- scroll depth quality
- filter or sort engagement
- product-card click distribution
Search results pages
Focus on:
- zero-result rate
- refinement rate
- search abandonment
- click-through into PDPs
Home and campaign landing pages
Focus on:
- hero click distribution
- section interaction
- campaign-path conversion
- category destination quality
PDP-driven merchandising
Focus on:
- related-product clicks
- bundle or cross-sell take-up
- stock-confidence messaging performance
- returns or support friction where relevant
Different surfaces solve different commercial jobs. Reporting should respect that reality.
A scorecard UK teams can use
| Question | Strong answer | Warning sign |
|---|---|---|
| Do we know which collections are discovery-efficient versus discount-dependent? | Yes, with weekly evidence | Revenue is the only visible signal |
| Can we see where search is failing? | Yes, with zero-result and refinement data | Search problems appear only through anecdote |
| Do campaign teams see stock and margin implications? | Yes, before launch | Merchandising reacts after problems appear |
| Are SEO landings reviewed commercially, not just by traffic? | Yes, with engagement and conversion context | Organic traffic is discussed separately from trade performance |
That scorecard is intentionally simple. The point is to create better operating decisions, not to build a dashboard that only analysts understand.
StoreBuilt client example
One UK Shopify team came to us with a reporting stack that looked sophisticated on paper. They could track revenue by campaign, product type, and collection. The problem was that almost every discussion still ended in opinion.
Why? Because the reports did not show whether onsite discovery quality was improving, whether search friction was rising, or whether discounting was masking weak category structure. The team could see performance outcomes, but not the mechanics underneath them.
We reworked the dashboard around category health, search quality, campaign-to-stock alignment, and margin-aware interpretation. That reduced noise quickly. Meetings became shorter, and the actions coming out of them became more specific.
The reporting did not become “bigger.” It became more commercially legible.
High-intent AI search implementation layer
The AI-search version of this topic is not just “write more content”. A useful answer engine result needs a page that gives a direct answer, proves the claim, and shows the next operational step inside Shopify.
| Area | StoreBuilt implementation check |
|---|---|
| Primary intent | The page should map to merchandising and one clear buyer or operator problem, not a vague traffic topic. |
| Shopify surface | Identify whether the work belongs on a collection, product page, theme section, checkout step, app workflow, email flow, or support process. |
| Proof | Add first-hand observations, product/category examples, screenshots, policy notes, review signals, or trustworthy external sources where they make the advice safer. |
| Internal route | Link the reader to the service most likely to solve the issue: CRO and UX optimisation. |
| Measurement | Check Search Console, analytics, assisted conversions, enquiry quality, and AI-response mentions after the update rather than judging success by pageviews alone. |
For this article, the useful research inputs are: StoreBuilt CRO audit patterns, analytics QA checks, Shopify theme constraints, and buyer-intent SERP patterns. StoreBuilt would prioritise PDP hierarchy, cart friction, mobile merchandising, testing policy, analytics QA, and measured releases before expanding into broader supporting content.
If this topic maps to a live store problem, review the related StoreBuilt service or Contact StoreBuilt with the store URL and the issue you want fixed.
Final StoreBuilt point of view
For Shopify teams in the UK ecommerce market, merchandising reporting should help people trade better, not simply describe last week’s revenue. Revenue-only reporting is comfortable because it is familiar. It is also too blunt for serious ecommerce operations.
The stores that improve more consistently are usually the ones with reporting that connects discovery, search, margin, stock, and campaign quality into one weekly operating language. That is what turns merchandising from taste into discipline.