
What we have seen in trading reviews is this: many Shopify teams open the conversion funnel report only after something already feels wrong. By that point, the conversation usually becomes reactive. Traffic is blamed, checkout is blamed, or seasonality is blamed before anyone explains which stage of the journey is actually weakening.
If your team needs a clearer read on where conversion is leaking, Contact StoreBuilt.
Table of contents
- Keyword decision and research inputs
- What Shopify’s conversion funnel reports actually show
- How to read the funnel without misleading yourself
- Symptom-to-action diagnosis table
- A weekly reporting cadence for UK ecommerce teams
- StoreBuilt example
- Final StoreBuilt point of view
Keyword decision and research inputs
Primary keyword: shopify conversion funnel
Secondary keywords:
- Shopify conversion report
- Shopify analytics conversion funnel
- ecommerce UK market conversion reporting
- Shopify reached checkout rate
- Shopify add to cart reporting
Search intent: practical and operational. The reader wants to interpret native Shopify reporting better and decide what to do next.
Funnel stage: middle.
Page type: reporting guide.
Why StoreBuilt can realistically win this topic:
- We can explain Shopify reporting in the language of trading action, not only analytics terminology.
- Many teams have access to the report but lack a diagnosis model for what different funnel-shape changes actually mean.
- UK competitor content often discusses CRO broadly but less often translates native Shopify reports into a weekly operating rhythm.
Research inputs used:
- Current Shopify Help documentation on behaviour reports, acquisition reports, marketing performance, and conversion summary concepts.
- UK competitor content patterns across CRO and ecommerce reporting topics.
- StoreBuilt observations from CRO reviews, weekly trading diagnosis, and funnel-stage content analysis.
What Shopify’s conversion funnel reports actually show
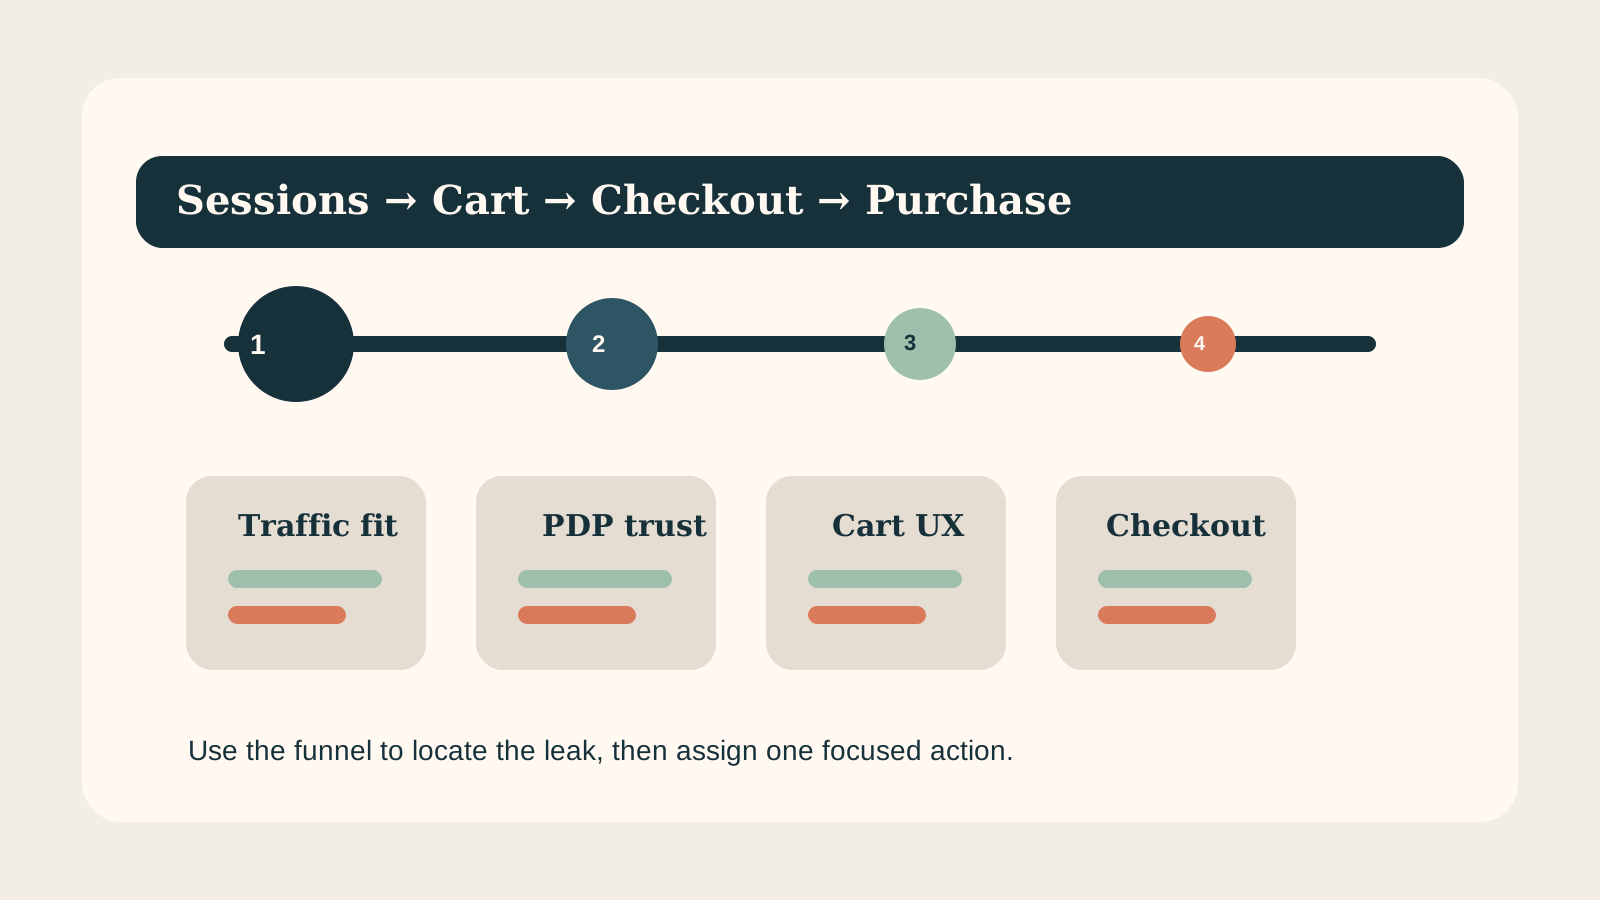
Shopify’s native behaviour and marketing performance documentation is clear on a useful point: the online store conversion report shows how sessions move from landing on the site to adding a product to cart, reaching checkout, and completing checkout. In other words, it gives you a stage view of where the journey is weakening.
That matters because not all conversion problems are the same.
If sessions are healthy but add-to-cart is weak, the issue often sits in relevance, merchandising, product offer clarity, or PDP trust. If add-to-cart is healthy but reached checkout is weak, the issue often sits in cart friction, shipping surprises, or momentum loss. If reached checkout is healthy but completed checkout is weak, payment, checkout confidence, or final-fee visibility deserves attention.
The funnel is useful because it turns a vague performance conversation into a location-specific one.
How to read the funnel without misleading yourself
1. Compare periods with similar demand shape
Comparing a heavy sale period against a quieter week without context produces noise. Use like-for-like trading windows where possible.
2. Segment by landing-page intent
A weak funnel from brand traffic and a weak funnel from non-brand SEO traffic do not imply the same fix. One may be a merchandising issue. The other may be an intent mismatch problem.
3. Watch step relationships, not only top-line conversion rate
A headline conversion rate can hide where the real damage sits. The stage movement tells a better story:
- weak sessions to cart often points to discovery or PDP issues;
- weak cart to checkout often points to cart or delivery friction;
- weak checkout completion often points to confidence, payment, or form burden.
4. Treat native reporting as a decision engine, not a vanity dashboard
Shopify’s native reports are most useful when paired with action thresholds. Do not just look at them. Decide what kind of movement triggers investigation.
5. Read the funnel beside merchandising and support signals
If funnel shape changes at the same time as zero-result search, refund reasons, or support tickets change, you usually have a stronger diagnosis faster.
Symptom-to-action diagnosis table
| Funnel symptom | Likely problem area | First actions |
|---|---|---|
| Sessions up, add-to-cart flat | Traffic quality mismatch, weak category or PDP relevance | Review landing-page intent, product-card clarity, category copy |
| Add-to-cart down sharply | PDP trust, price framing, out-of-stock or variant friction | Audit top PDPs, stock visibility, variant UX, offer message |
| Reached checkout weak | Cart friction, shipping uncertainty, promo confusion | Review cart UX, delivery copy, threshold logic, promo stack |
| Checkout completion weak | Payment trust, fee surprise, mobile form friction | Review payment mix, final cost visibility, mobile checkout behaviour |
| Funnel volatile by device | Mobile UX inconsistency | Compare template behaviour and mobile trust path |
| Funnel stable, revenue weaker | AOV or product-mix issue | Review bundle logic, upsell quality, price mix, margin-sensitive merchandising |
This table is useful because it protects the team from jumping to the loudest explanation first.
A weekly reporting cadence for UK ecommerce teams
Monday: look for abnormal step movement
Start with:
- sessions;
- add-to-cart rate;
- reached checkout rate;
- completed checkout rate.
Do not stop at the headline conversion number.
Tuesday: inspect the routes driving the change
Review:
- top landing pages;
- top converting products;
- top drop-off product groups;
- traffic source mix.
This step tells you whether the issue is general or concentrated.
Wednesday: pair reporting with qualitative evidence
Bring in:
- support-ticket themes;
- on-site search behaviour;
- stock or promo changes;
- campaign and email timing.
By this point, the team should be able to state a likely cause, not just notice a symptom.
Thursday: assign one focused action
This is where many teams fail. They see five possibilities and act on none. The better approach is one clear sprint move:
- rework a PDP module order;
- fix shipping copy;
- simplify a cart rule;
- pause a poor-fit landing campaign;
- improve mobile category filtering.
Friday: record what changed and why
The value compounds when the team can connect reporting movement back to operational changes over time.
If your team wants clearer weekly CRO reporting discipline, StoreBuilt can help.
StoreBuilt example
One Shopify brand saw conversion softness and initially assumed the issue was weaker traffic quality from new campaigns. The top-line rate had dropped enough to create concern, but the diagnosis was still vague.
Once we reviewed the funnel properly, the picture changed. Sessions were not the main problem. The unusual movement sat between cart and reached checkout after a shipping-promise change and a promotion layer that created more hesitation than urgency. The business did not need a sitewide redesign. It needed a clearer cart and delivery communication model.
That is the value of the report when used properly. It narrows the commercial conversation.
High-intent AI search implementation layer
The AI-search version of this topic is not just “write more content”. A useful answer engine result needs a page that gives a direct answer, proves the claim, and shows the next operational step inside Shopify.
| Area | StoreBuilt implementation check |
|---|---|
| Primary intent | The page should map to shopify analytics and one clear buyer or operator problem, not a vague traffic topic. |
| Shopify surface | Identify whether the work belongs on a collection, product page, theme section, checkout step, app workflow, email flow, or support process. |
| Proof | Add first-hand observations, product/category examples, screenshots, policy notes, review signals, or trustworthy external sources where they make the advice safer. |
| Internal route | Link the reader to the service most likely to solve the issue: CRO and UX optimisation. |
| Measurement | Check Search Console, analytics, assisted conversions, enquiry quality, and AI-response mentions after the update rather than judging success by pageviews alone. |
For this article, the useful research inputs are: StoreBuilt Shopify audits, UK ecommerce SERP intent, Shopify platform documentation, and AI-search measurement patterns. StoreBuilt would prioritise PDP hierarchy, cart friction, mobile merchandising, testing policy, analytics QA, and measured releases before expanding into broader supporting content.
If this topic maps to a live store problem, review the related StoreBuilt service or Contact StoreBuilt with the store URL and the issue you want fixed.
Final StoreBuilt point of view
Shopify’s conversion funnel reports are not advanced because they are complex. They are valuable because they force stage clarity. UK ecommerce teams that use them well do not ask “Why is conversion down?” in the abstract. They ask which stage weakened, which route caused it, and which operational or UX decision probably changed the outcome. That discipline is what turns reporting from observation into growth control.